OpenTelemetry Trace Context Propagation with Message Brokers and Go
.jpg)

Developing observable applications communicating via message brokers can be tough. However, OpenTelemetry simplifies this process. Learn how to use context propagation with NATS!
Table of Contents
Get started with Tracetest!
Try Managed Tracetest Today!
A big challenge in developing an application with observability that communicates through message brokers, such as queues and streams, is executing a single operation that involves multiple applications while maintaining visibility of the entire operation in a single trace.
Several message brokers, such as [NATS](https://nats.io/) and database queues, are not supported by OpenTelemetry (OTel) SDKs. This article will guide you on how to use context propagation explicitly with these message queues.
We will explain the following topics:
1. A brief explanation about OpenTelemetry Traces and Trace Contexts.
2. How a Trace Context is propagated across a distributed system.
3. How to propagate a trace between a producer and a consumer.
## What are Traces and Trace Contexts?
Traces are signals that your application emits every time it runs an operation. This information helps you understand what the application was doing internally while executing the operation associated with that trace.
A trace is a set of spans that have a parent-child relationship with each other. Each span has a name, attributes, duration, and more attributes, that can be seen in the [official documentation](https://opentelemetry.io/docs/concepts/signals/traces/).
Here is a typical trace from the [OpenTelemetry demo project](https://opentelemetry.io/docs/demo/).
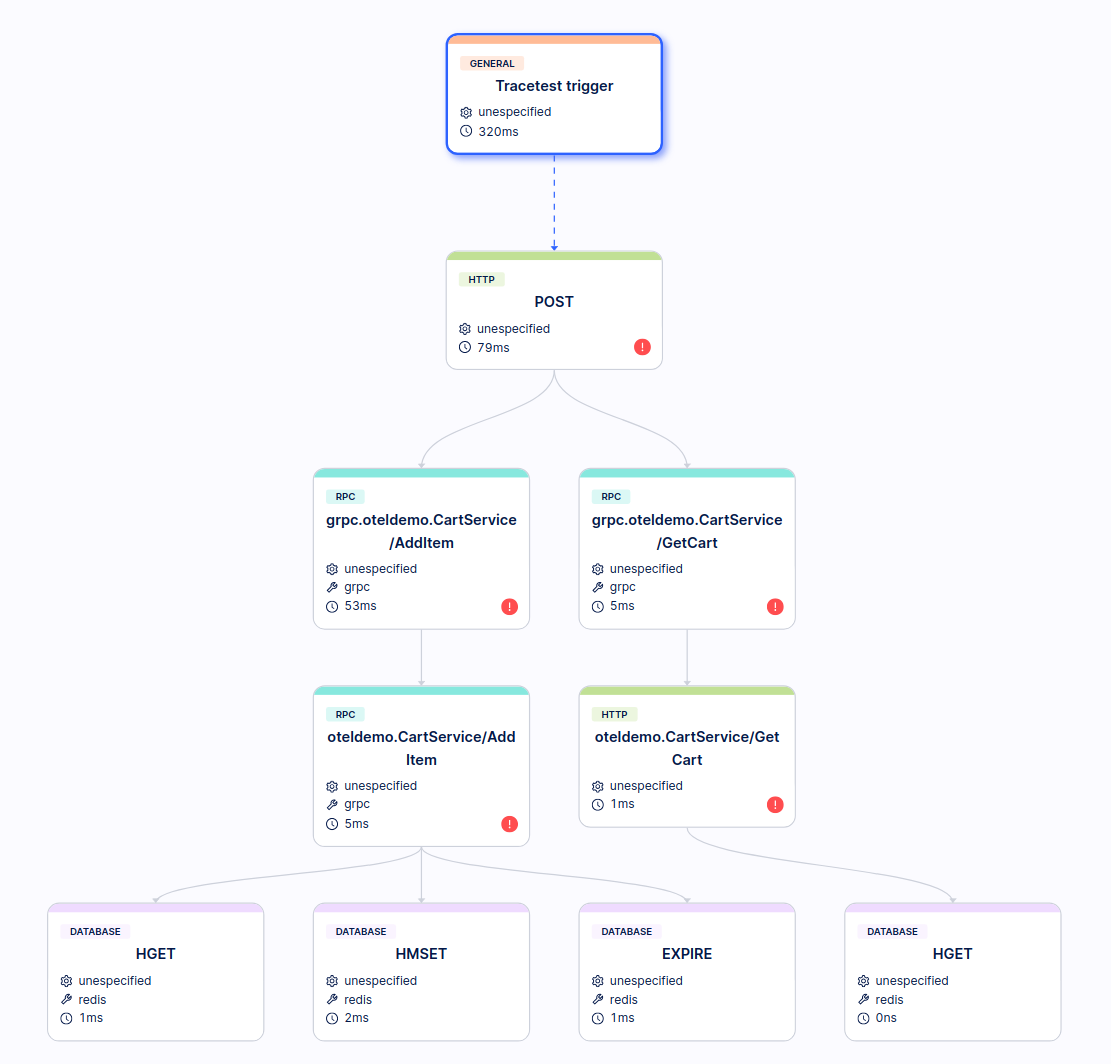
As you have noticed, usually a span has a parent span. OpenTelemetry decides which span should be assigned as the parent span by looking at the `Trace Context`. This is easily understood in the language Go, as it uses the concept of contexts. When you start a new span in Go, you get two things:
- the span itself
- its context
```go
spanCtx, span := tracer.Start(ctx, "POST /api/user")
```
In this example, if `ctx` doesn’t contain any information about the trace, the generated span will have a new `TraceID` and it will be the root element of the trace, which means it will have no parent. However, if there is information about the trace, the `TraceID` from the context will be assigned to the new span, and its parent will be chosen using the `SpanID` field in the context.
In either case, the new context `spanCtx` will now contain information about this span, so if `spanCtx` is used to create a new span, the new span will be a child of `POST /api/user`.
If we want a concise trace, we must pay attention to the trace context and ensure it’s being used correctly.
## Trace Context Across Multiple Services
When you have one application, everything is simpler. And tracing is no different. Generating traces for one single system is easy, you don’t have to care much about the trace context as it is available to you at all times.
However, what happens if your application requires an HTTP call? How do we ensure the second application will append spans to the existing trace and not create a new one instead?
The answer is `Context Propagation`. The HTTP example is a classic and [W3C](https://www.w3.org/TR/trace-context/) even covers it. The propagation is adding the important fields from the context into the HTTP headers and having the other application extract those values and inject them into its trace context. This concept applies to any other way of communication. Here, we will focus on message brokers and how you can achieve context propagation for those.
## Context Propagation Through Message Brokers
Like HTTP, most message brokers support a `header` field when sending or receiving a message. It means both producers and consumers of messages can use it. If both applications rely on OpenTelemetry, propagation becomes very simple as OpenTelemetry SDKs already ships with propagation helper functions.
In this example, I’ll be using [the `Golang` SDK](https://opentelemetry.io/docs/languages/go/).
### Propagator Setup
In OpenTelemetry, there’s the concept of a context propagator. It is an entity capable of injecting and extracting context from a carrier.
```go
// TextMapPropagator propagates cross-cutting concerns as key-value text
// pairs within a carrier that travels in-band across process boundaries.
type TextMapPropagator interface {
// Inject set cross-cutting concerns from the Context into the carrier.
Inject(ctx context.Context, carrier TextMapCarrier)
// Extract reads cross-cutting concerns from the carrier into a Context.
Extract(ctx context.Context, carrier TextMapCarrier) context.Context
// Fields returns the keys whose values are set with Inject.
Fields() []string
}
```
There are two types of propagators in OpenTelemetry:
- Trace Context Propagators
- Baggage Propagators
For this article, I’ll only focus on trace context propagation. To create one is fairly simple:
```go
propagator := propagation.TraceContext{}
```
You can now use this propagator to inject and extract the trace context from a message broker’s message header.
I’ll showcase this by using a component to send and receive messages using [NATS](https://docs.nats.io/nats-concepts/overview).
```go
type NATSManager struct {
conn *nats.Conn
}
func NewNATSManager(conn *nats.Conn) *NATSManager {
return &NATSManager{conn: conn}
}
func (m *NATSManager) Publish(ctx context.Context, subject string, message interface{}) error {
data, err := json.Marshal(message)
if err != nil {
return fmt.Errorf("could not marshal message into JSON: %w", err)
}
header := make(nats.Header)
err = m.conn.PublishMsg(&nats.Msg{
Subject: subject,
Header: header,
Data: data,
})
if err != nil {
return fmt.Errorf("could not publish message: %w", err)
}
return nil
}
func (m *NATSManager) Subscribe(subject string, callback func(ctx context.Context, data []byte) (*nats.Subscription, error) {
subscription, err := m.conn.Subscribe(subject, func(msg *nats.Msg) {
ctx := context.Background()
callback(ctx, msg.Data)
})
if err != nil {
return nil, fmt.Errorf("could not subscribe to topic: %w", err)
}
return subscription, nil
}
```
Now, introduce the changes necessary for propagating the trace context in the code.
```go
func (m *NATSManager) Publish(ctx context.Context, subject string, message interface{}) error {
data, err := json.Marshal(message)
if err != nil {
return fmt.Errorf("could not marshal message into JSON: %w", err)
}
header := make(nats.Header)
// ADD THIS FOR TRACE CONTEXT PROPAGATION
propagator := propagation.TraceContext{}
propagator.Inject(ctx, propagation.HeaderCarrier(header))
// *******
err = m.conn.PublishMsg(&nats.Msg{
Subject: subject,
Header: header,
Data: data,
})
if err != nil {
return fmt.Errorf("could not publish message: %w", err)
}
return nil
}
func (m *NATSManager) Subscribe(subject string, callback func(ctx context.Context, data []byte) (*nats.Subscription, error) {
subscription, err := m.conn.Subscribe(subject, func(msg *nats.Msg) {
ctx := context.Background()
// Changes start here
propagator := propagation.TraceContext{}
ctx = propagator.Extract(ctx, propagation.HeaderCarrier(msg.Header))
// End of changes
callback(ctx, msg.Data)
})
if err != nil {
return nil, fmt.Errorf("could not subscribe to topic: %w", err)
}
return subscription, nil
}
```
When consumers and producers use this component to send and receive messages via NATS, the context will be propagated automatically without any code changes.
The introduced changes use the helper functions from OpenTelemetry to inject the trace context into the message header by serializing it as `traceparent: "context-info"` and then the consumer code will read the same header, extract it into an actual trace context and inject it into our Go context. After this, it will use the same context as the caller application.
## Final Remarks
The most effective way to propagate trace context without altering your app's internals is by adding middleware functions and decorating components. This is precisely the approach we took with Tracetest. We used a wrapper library for all components interacting with NATS, ensuring default trace context propagation for all modules.
Context propagation is easy when you work with OpenTelemetry. It provides the necessary tools to streamline handling traces. The hard part of context propagation is understanding the boundaries of your systems and adding instrumentation to the components that interact with anything outside those boundaries.
OpenTelemetry ships with an auto-instrumentation feature that covers third-party applications such as databases, HTTP clients, frameworks, etc. But, if you use something that isn’t covered, you can instrument it yourself, just like we did at Tracetest when working with NATS.
Would you like to learn more about Tracetest and what it brings to the table? Visit the Tracetest [docs](https://docs.tracetest.io/getting-started/installation) and try it out by [signing up](https://app.tracetest.io/) today!
Also, please feel free to join our [Slack Community](https://dub.sh/tracetest-community), give [Tracetest a star on GitHub](https://github.com/kubeshop/tracetest), or schedule a [time to chat 1:1](https://calendly.com/ken-kubeshop/45min).
Related Content
.jpg)
.jpg)

Stay in the Loop

Join the Tracetest Community in one of these channels:


— a first of its kind open source accelerator focused on the cloud native ecosystem


